
IPRO is one of the most robust terminal operating systems available for intermodal operations. It features intuitive, real-time rail planning, advanced integrations, drag-and-drop graphical productivity enhancements, and flexible yard planning tools. But there’s one feature that isn’t quite as glamorous but is arguably one of the most powerful and extensible tools found in the software — IPRO’s Find Tool.
The Find Tool allows IPRO users to create nearly limitless reports, combining data fields in novel ways to drive unique insights. Reporting is often a difficult process to configure with other solutions, requiring software engineers to write custom code. This limits the utility of your data, preventing you from pivoting quickly to chase insights where the information takes you.
Instead, do it yourself with IPRO. The Find Tool makes it easy to generate fully custom reports that update in real-time. And with global/private saved searches, you can create complex reports and then save the search criteria for later use. Not only does this feature save your search parameters, but it also remembers your preferred column order for viewing. Additionally, searches can be saved for individual users or as global parameters for the entire terminal.
With IPRO, you can slice and dice your data any way you can imagine. Let’s get an appreciation for what the Find Tool can do for you by looking at a few examples.
RELATED: See your terminal like you never have before with Terminal View 3D Data Visualization.
Chassis on Terminal Report
Imagine you needed to know how many chassis were in the terminal at a given time. Additionally, you were interested in dividing them up by type. You could define a saved search that looked for the equipment type “chassis,” whether inbound, outbound, thru, transrail, or in storage. You could search specifically in the gate and the yard.
The search populates a table with every piece of equipment that matches your parameters, dividing the data into columns. You can alter column order and then record their positions as part of the saved search.
Once the table has populated, creating reports is a simple process of selecting the column names you want to be included and then clicking Recap. In this case, we’re building a recap report using the columns Chassis Agreement and Chassis Status to create an accounting that shows us all of our agreement types and how many of each fall into specific statuses.
If we decide we want to include size, it’s a simple matter of adding the Chassis Size column to our selection and clicking Recap again. In this way, you can shuffle datapoints around in a wide variety of configurations to learn precisely what you need to know.
What This Report Tells Us
The Chassis on Terminal report affords terminals a detailed view of their chassis utilization. It reveals the total number of chassis in each pool and provides counts for those used, available, and stacked in the yard.
When terminals understand how their chassis are being used they can monitor levels for specific pool agreements. If they’re storing too many, they might send them to a neighboring terminal. If too few, they’ll be ready to find more when needed. You can add other criteria, such as size and type, to further refine the search.

The advantage you get in executing this way are represented in the report above:
- Report column has a recognizable name (vs. Find: Equipment as you would see for this query if run manually using ‘Find’)
- Columns are static for this report and are unaffected by the other reports you are running / columns changing
- Recap function with static columns
- In this case, we’re using two columns, but more columns can be used depending on how you want to dice your data
- We have a very useful recap that tells users how many chassis for each chassis pool are on the terminal and what state they are in.

Containers on Terminal Report
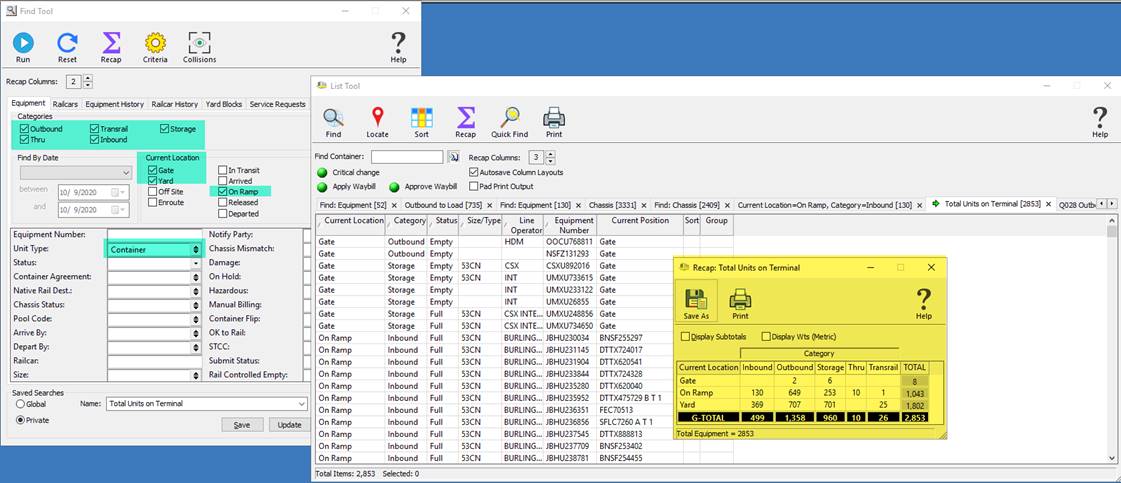
This search is identical to the last, save swapping out unit type “container” for “chassis.” However, by reordering the information columns returned, we gain unique insights. In this case, we’re highlighting Current Location and Category to learn how many of each container type we currently have in the terminal and their locations.
Executing reports this way has several advantages. For one, your columns can either be static or dynamic, depending on your needs. If a default column order is sufficient for a specific search, there’s no need to save it. But when order matters, you have full flexibility to record precise layouts. You can use the recap function whether your columns are static or not.
Saved searches also allow you to name your search parameters. For example, in a manual search, the search term “Find: Equipment” is used. This might be fine for a quick, one-off analysis, but for parameters you use frequently, you need a meaningful name that allows you to quickly identify the search you’re looking for.
The Find Tool gives you access to every datapoint you track in your TOS and provides unmatched flexibility to create the reports you require.

What This Report Tells Us
The Containers of Terminal report provides a quick, easy-to-read breakdown of container locations throughout your complex.
In this example, we can see that we have 2,653 containers scattered across the terminal. Drilling down, it’s clear that 790 of them are on the ramp in the following locations:
- 130 are awaiting unloading
- 649 are loaded to rail, awaiting departure
- Ten are passing through
- One needs loading to a different train
The remaining 1,802 containers can be found in the yard:
- 369 are targeted for gate pickup
- 707 await loading to rail
- 25 transrail containers also require loading
- 701 are currently empty in storage
Seeing containers broken down this way helps operators better manage labor, equipment, and container utilization. It’s clear from the numbers that more containers currently need loading than offloading, which may dictate a shift in labor. The terminal might also decide to move empty containers to another terminal if they have too many vacant units taking up space in their yard.
IPRO’s Find Tool Puts the Information You Need at Your Fingertips
The Find Tool helps terminals of every size keep track of data critical to their operation. To analyze the daily nuts and bolts of your business there’s no simpler way to monitor activity than with IPRO’s Find Tool. For even greater visibility and reliable performance metrics, be sure to explore the benefits of Tideworks Insight.
Check out our recorded IPRO Demo to learn more.
Terminal View Intermodal Data Visualization
Terminal View gives you the ability to take an in-depth look at your terminal’s day-to-day operations and make strategic decisions based on your new insight.

